Note
Click here to download the full example code
Model Error Analysis for the Boston houses dataset
Here we train a RandomForestRegressor to predict the price of the houses in Boston. This is our primary model. Then we build a secondary model, called Error Tree, to predict on what samples the primary model returns wrong or correct predictions. The Error tree is a DecisionTree returning a binary outcome success/failure. The leaves yielding failure outcome gather the samples mis-predicted by the primary model. Plotting the feature distributions of these samples and comparing to the whole data highlights the subpopulations where the model works poorly.
When using a python notebook, set %matplotlib inline to enable display.
Those are the necessary imports and initializations.
from sklearn.datasets import load_boston
from sklearn.model_selection import train_test_split
from sklearn.ensemble import RandomForestRegressor

import numpy as np
import random

import matplotlib.image as mpimg
import matplotlib.pyplot as plt

from mealy.error_analyzer import ErrorAnalyzer
from mealy.error_visualizer import ErrorVisualizer
import mealy
print(mealy.__version__)
default_seed = 10
np.random.seed(default_seed)
random.seed(default_seed)
Out:
0.2.4
Load Boston houses dataset.
dataset = load_boston()
X = dataset.data
y = dataset.target
feature_names = dataset.feature_names

X_train, X_test, y_train, y_test = train_test_split(X, y)
Train a RandomForestRegressor.
model = RandomForestRegressor()
model.fit(X_train, y_train)

r2_score = model.score(X_test, y_test)
print("R2 = %.2f" % r2_score)
Out:
R2 = 0.87
Fit an Error Tree on the model performances.
error_analyzer = ErrorAnalyzer(model, feature_names=feature_names)
error_analyzer.fit(X_test, y_test)
Print metrics regarding the Error Tree.
Out:
The Error Decision Tree was trained with accuracy 98.43% and balanced accuracy 94.74%.
The Decision Tree estimated the primary models accuracy to 86.61%.
The true accuracy of the primary model is 85.04.%
The Fidelity of the error tree is 98.43%.
The error tree is considered representative of the primary model performances.
Plot the Error Tree.
error_visualizer = ErrorVisualizer(error_analyzer)
tree_src = error_visualizer.plot_error_tree()

# the output of ``plot_error_tree`` is rendered automatically in a python notebook
# the following is for rendering in this sphinx gallery
tree_src.format = 'png'
tree_src.render('tree')
tree_img = mpimg.imread('tree.png')

plt.figure(figsize=(20, 20))
plt.imshow(tree_img)
plt.axis('off')
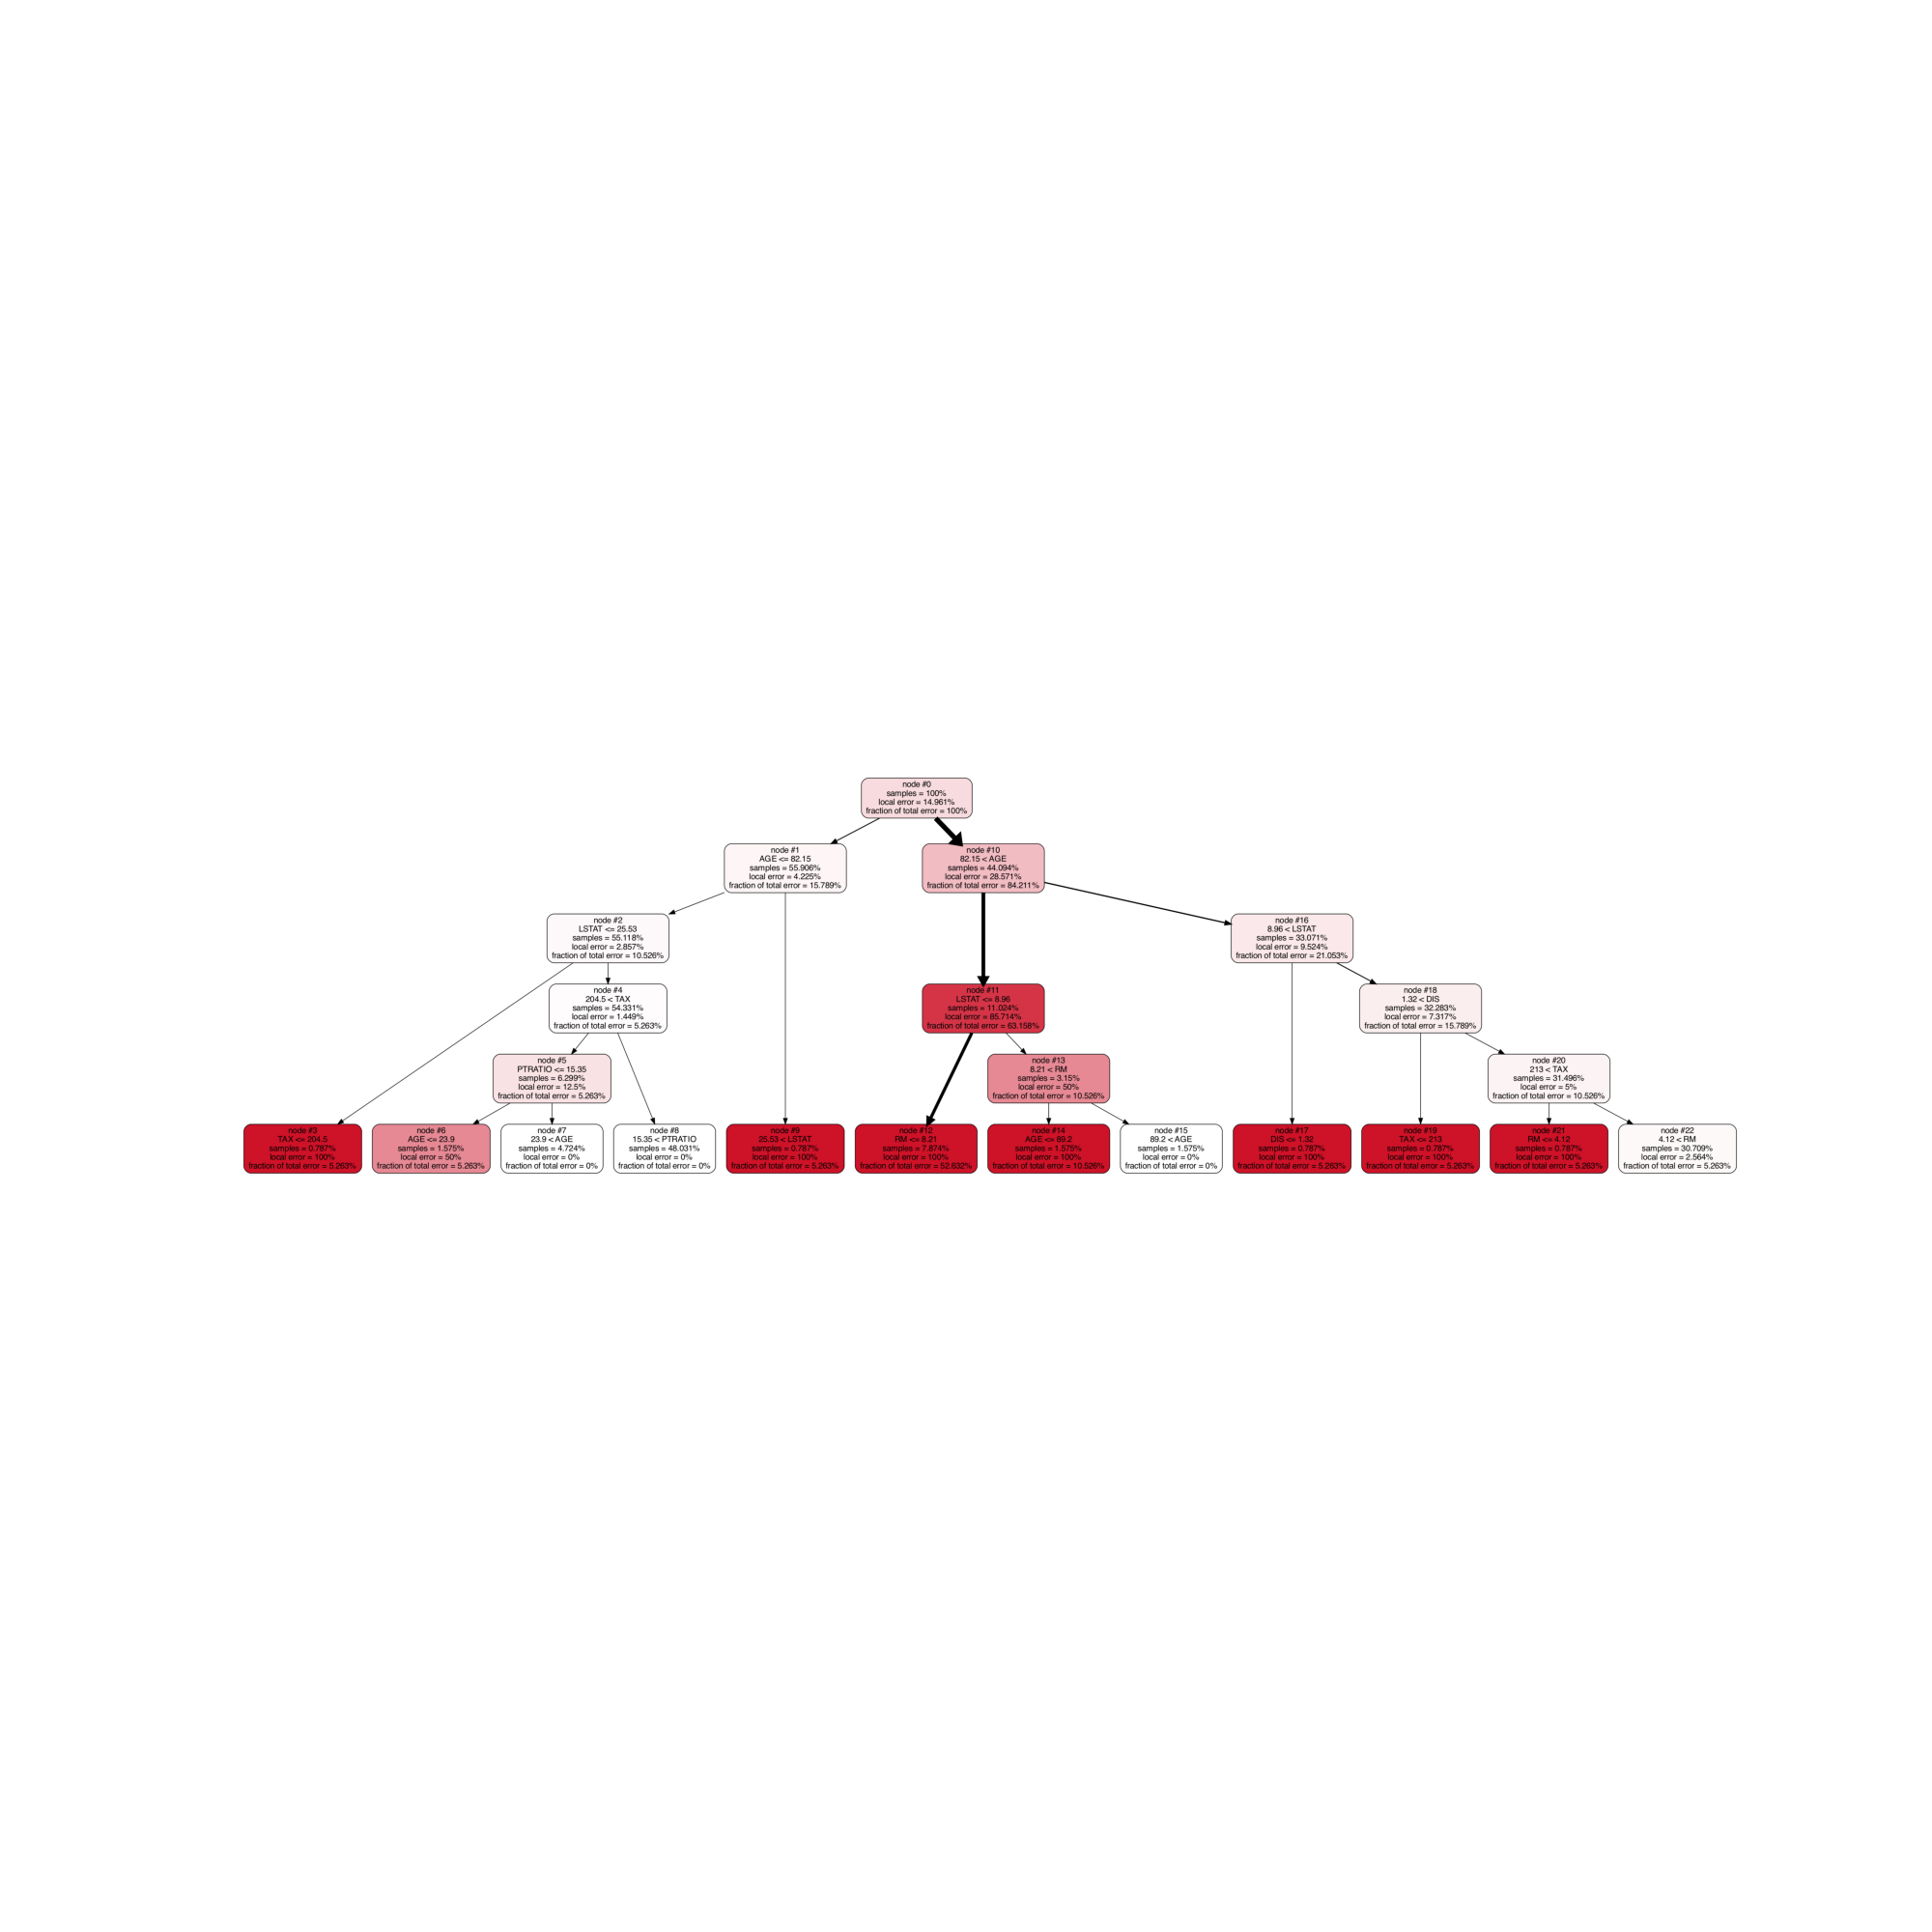
Print the details regarding the decision tree nodes containing the majority of errors.
error_analyzer.get_error_leaf_summary(leaf_selector=None, add_path_to_leaves=True);
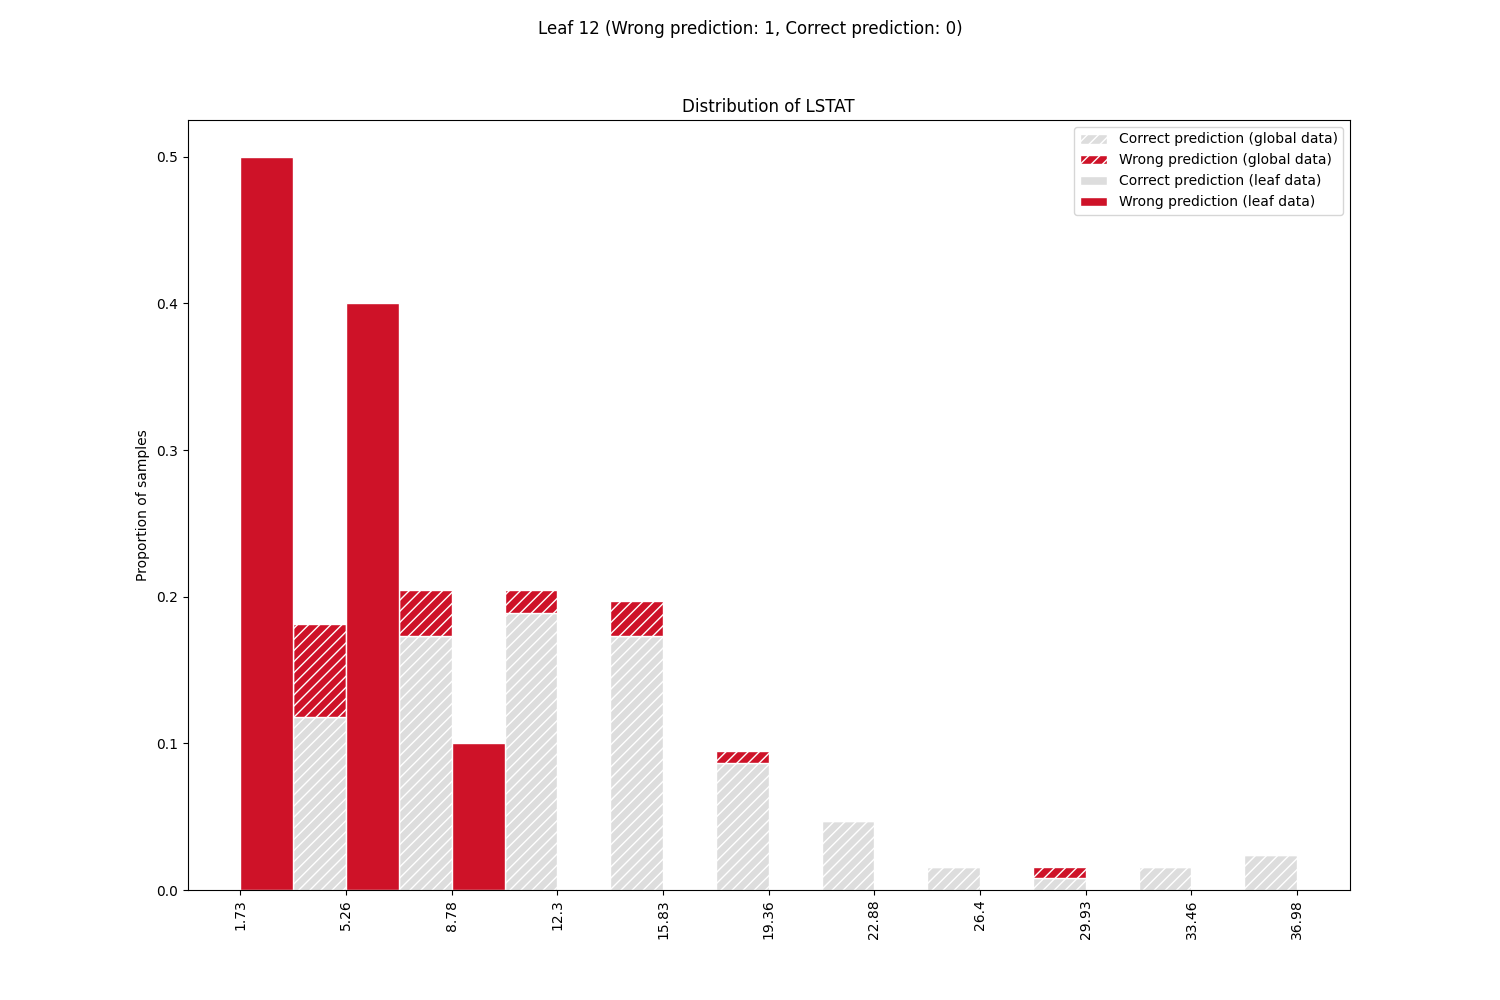
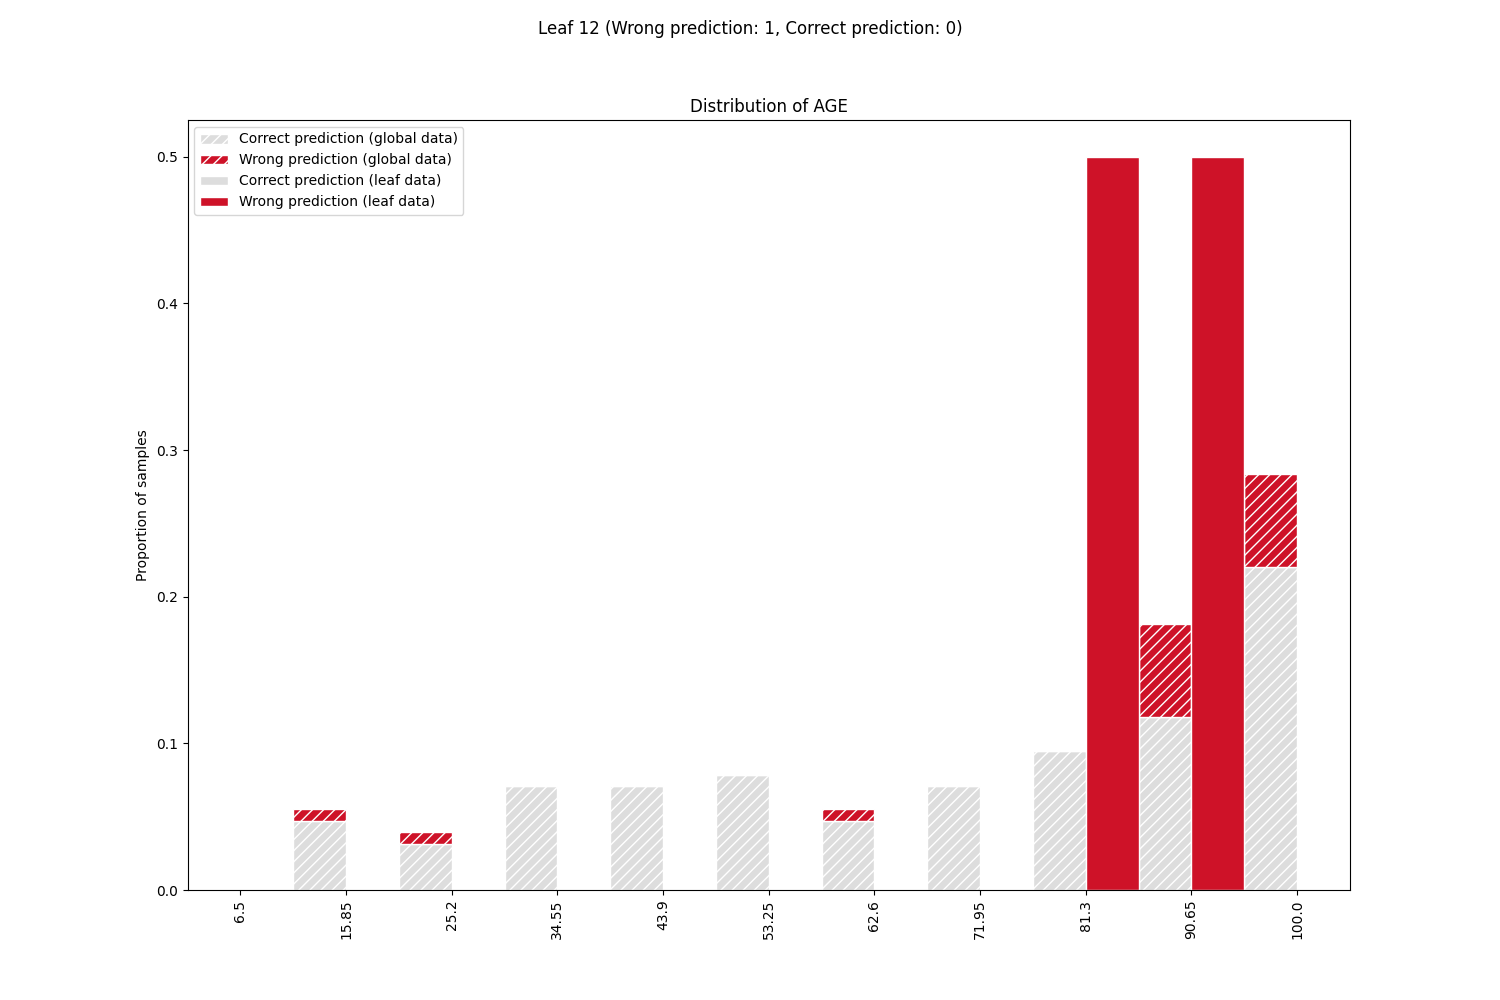
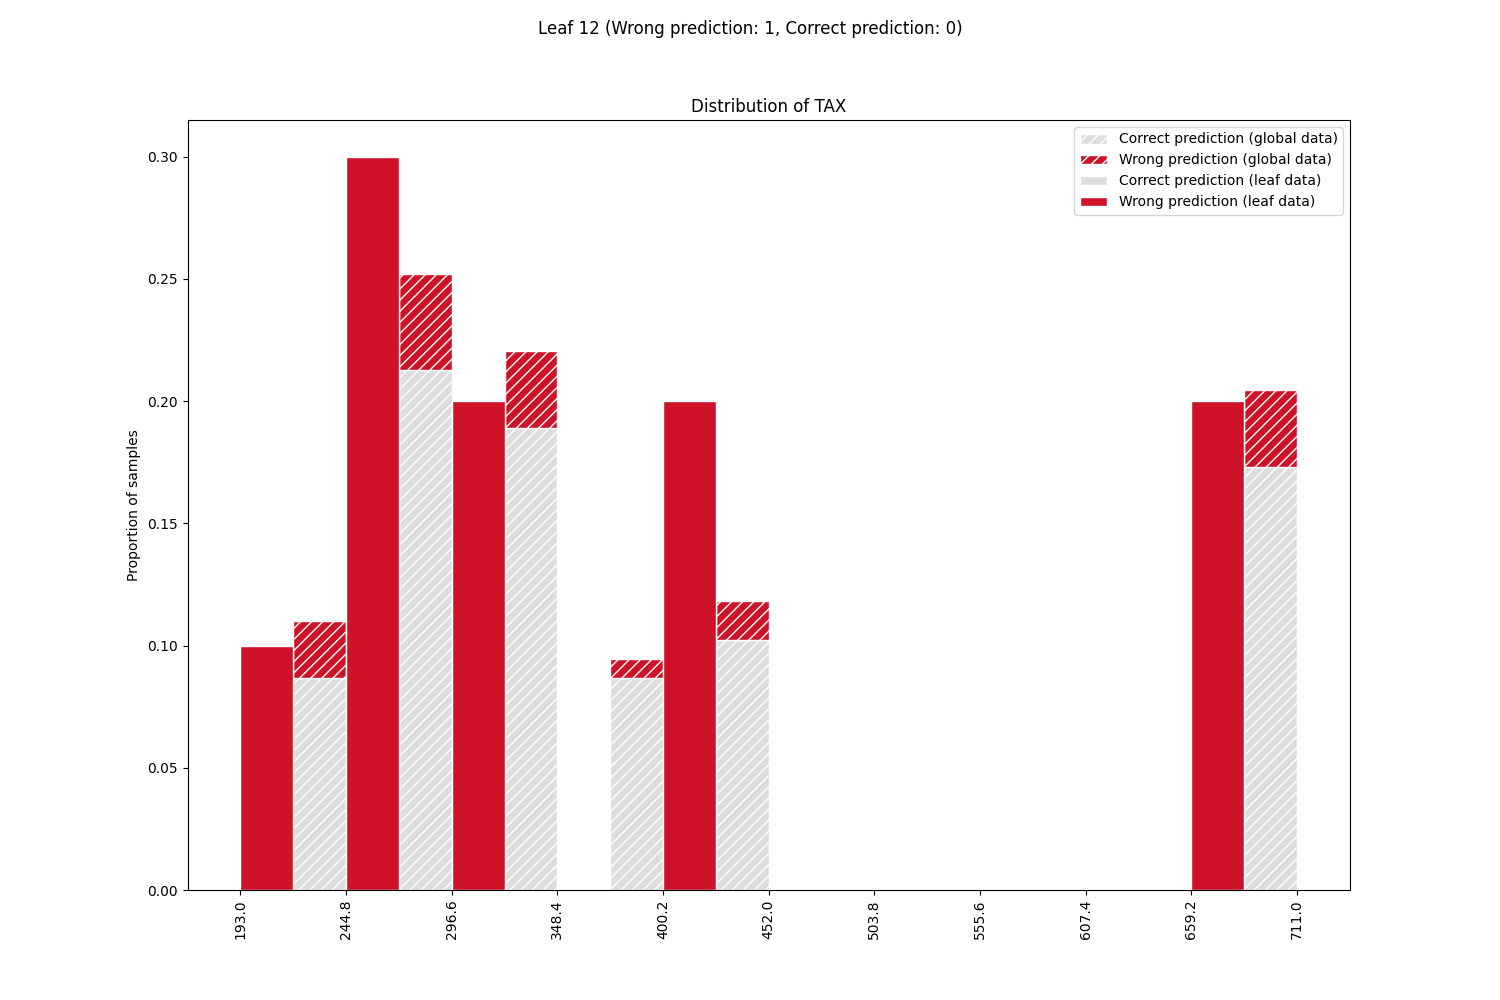
Plot the feature distributions of samples in the leaf containing the majority of errors. Rank features by correlation to error.
Discussion
Error Tree Metrics
We are dealing with a regression task, but the metrics highlight the accuracy of the primary model and its estimate given by the Error Tree. Here the primary predictions of price have been categorized in two classes: ‘Correct prediction’ and ‘Wrong prediction’ by thresholding the deviation of the prediction from the true value. Close enough predictions are Correct prediction, the others are Wrong prediction. For more details, have a look at the documentation. The accuracy is then the number of Correct predictions over the total. The Error Tree is representative of the behavior of the primary model as the true primary accuracy and the one estimated by the Error Tree are close.
Model Failures
Let’s focus on the nodes of the Error Tree DecisionTree, in particular the leaves
of class ‘Wrong prediction’. These leaves contain the majority of errors, each
leaf clustering a subpopulation of errors with different feature values. The largest
and purest failure nodes are highlighted when printing the error node summary, and
also when plotting the feature distributions in the node (leaf_selector=None).
From the feature distributions, sorted by correlation with the error, we can see that
the majority of problems occur for extreme values of features LSTAT and AGE.
In the next iteration of model design, the primary model needs to be improved for these
subpopulations.
Total running time of the script: ( 0 minutes 3.588 seconds)