Note
Click here to download the full example code
Model Error Analysis with scikit-learn Pipeline for the Adult income dataset
Here we train a RandomForestClassifier to predict whether a person gains more or less than 50k per year. This is our primary model. Before training the primary model we preprocess the categorical and numeric features of the dataset by means of a scikit-learn Pipeline. Then we build a secondary model, called Error Tree, to predict on what samples the primary model returns wrong or correct predictions. The Error Tree is a DecisionTree returning a binary outcome success/failure. The leaves yielding failure outcome gather the samples mis-predicted by the primary model. Plotting the feature distributions of these samples and comparing to the whole data highlights the subpopulations where the model works poorly.
When using a python notebook, set %matplotlib inline to enable display.
Those are the necessary imports and initializations.
from sklearn.model_selection import train_test_split
from sklearn.ensemble import RandomForestClassifier
from sklearn.compose import ColumnTransformer
from sklearn.preprocessing import StandardScaler, OneHotEncoder
from sklearn.impute import SimpleImputer
from sklearn.pipeline import Pipeline

import pandas as pd
import numpy as np
import random

import matplotlib.image as mpimg
import matplotlib.pyplot as plt

from mealy.error_analyzer import ErrorAnalyzer
from mealy.error_visualizer import ErrorVisualizer


default_seed = 10
np.random.seed(default_seed)
random.seed(default_seed)
Load Adult income dataset.
adult_income_url = 'https://www.openml.org/data/get_csv/54002/adult-census.arff'

df = pd.read_csv(adult_income_url)

row_id = 'ID'
df = df.drop([row_id], axis=1)

target = 'class'


X = df.dropna().drop(target, axis=1)
y = df.dropna()[target]

X_train, X_test, y_train, y_test = train_test_split(X, y, test_size=0.2)

numeric_features = df.select_dtypes(include=['int64', 'float64']).columns.tolist()
categorical_features = df.select_dtypes(include=['object']).drop([target], axis=1).columns.tolist()

feature_names = numeric_features + categorical_features

print('Categorical features of the adult dataset:')
print(categorical_features)
print('Numeric features of the adult dataset:')
print(numeric_features)
Out:
Categorical features of the adult dataset:
['workclass', 'education:', 'marital-status:', 'occupation:', 'relationship:', 'race:', 'sex:', 'native-country:']
Numeric features of the adult dataset:
['age', 'fnlwgt:', 'education-num:', 'capital-gain:', 'capital-loss:', 'hours-per-week:']
Build the preprocessing Pipeline.
The final Pipeline is required to contain two steps: the first step should be a sklearn.compose.ColumnTransformer accounting for the preprocessing of the features, while the second step should be a sklearn.base.BaseEstimator, representing the primary model to investigate. The sklearn.compose.ColumnTransformer should contain the desired preprocessing steps by groups of columns. The columns not specified in the sklearn.compose.ColumnTransformer are dropped by default, unless using the option remainder=’passthrough’, in which case they are included without preprocessing.
numeric_transformer = Pipeline(steps=[
    ('imputer', SimpleImputer(strategy='median')),
    ('scaler', StandardScaler())])
categorical_transformer = Pipeline(steps=[
    ('imputer', SimpleImputer(strategy='constant', fill_value='missing')),
    ('onehot', OneHotEncoder(handle_unknown='ignore'))])

preprocessor = ColumnTransformer(
    transformers=[
        ('num', numeric_transformer, numeric_features),
        ('cat', categorical_transformer, categorical_features)])

model = Pipeline(steps=[('preprocessor', preprocessor),
                        ('classifier', RandomForestClassifier(n_estimators=10))])
Train preprocessing Pipeline and RandomForestClassifier.
Out:
Acc = 0.85
Fit an Error Tree on the model performances.
error_analyzer = ErrorAnalyzer(model, feature_names=feature_names)
error_analyzer.fit(X_test, y_test)
Print metrics regarding the Error Tree.
Out:
The Error Decision Tree was trained with accuracy 85.09% and balanced accuracy 59.37%.
The Decision Tree estimated the primary models accuracy to 93.51%.
The true accuracy of the primary model is 84.77.%
The Fidelity of the error tree is 91.26%.
The error tree is considered representative of the primary model performances.
Plot the Error Tree.
error_visualizer = ErrorVisualizer(error_analyzer)
tree_src = error_visualizer.plot_error_tree()

# the output of ``plot_error_tree`` is rendered automatically in a python notebook with sliders
# the following is for rendering in this sphinx gallery
tree_src.format = 'png'
tree_src.render('tree')
tree_img = mpimg.imread('tree.png')

plt.figure(figsize=(20, 20))
plt.imshow(tree_img)
plt.axis('off')

Print the details regarding the decision tree nodes containing the majority of errors.
error_analyzer.get_error_leaf_summary(leaf_selector=None, add_path_to_leaves=True);
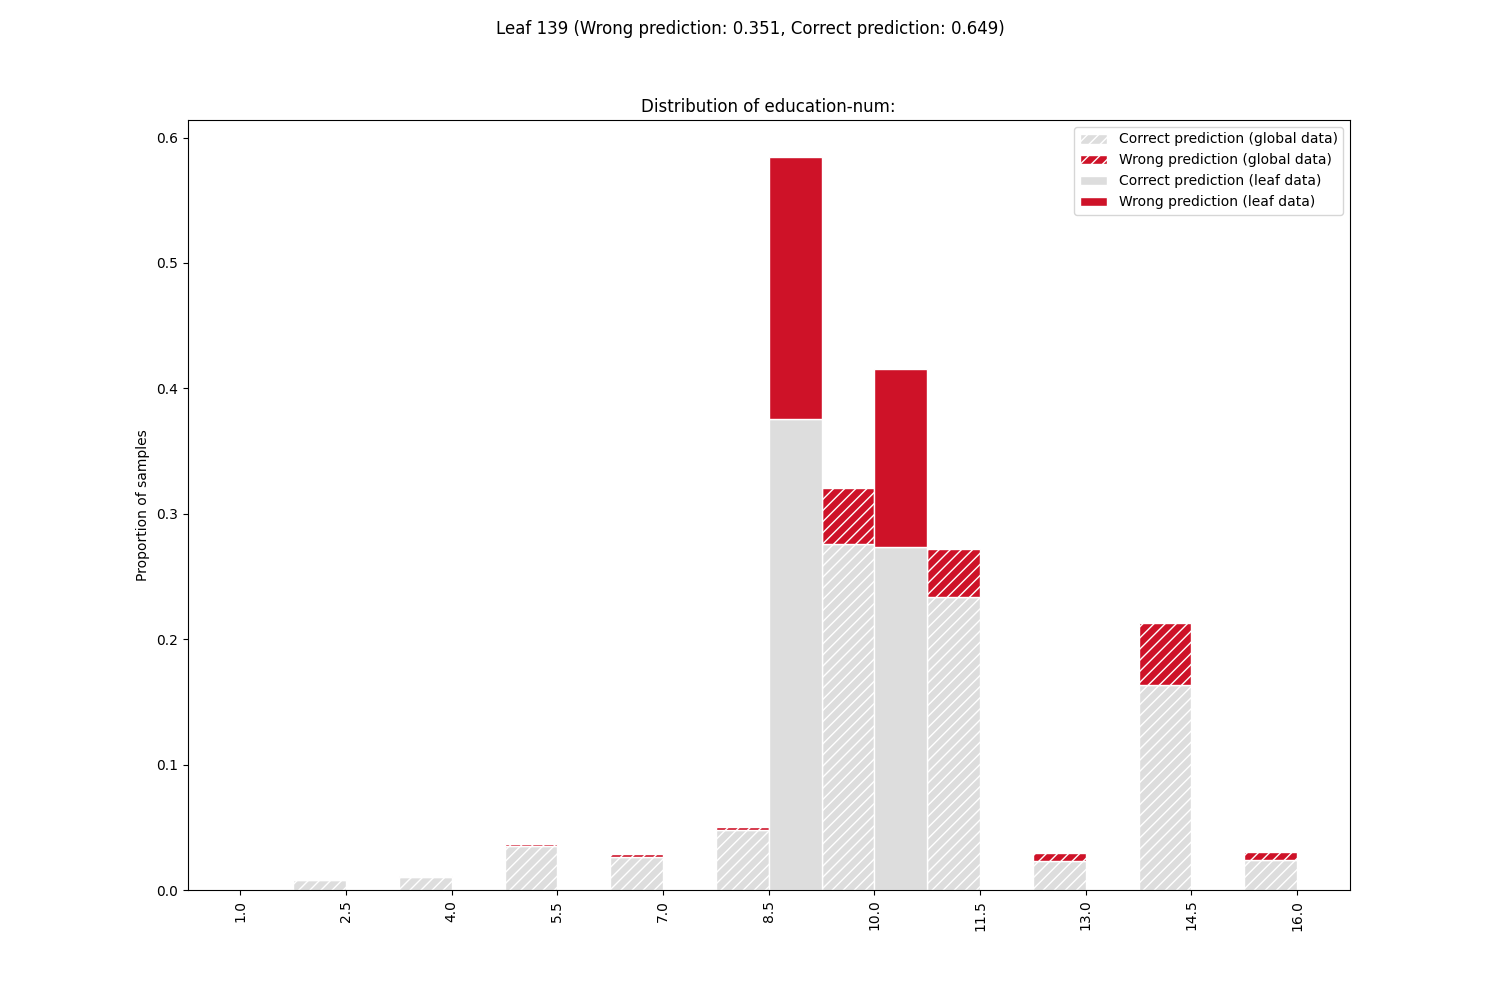
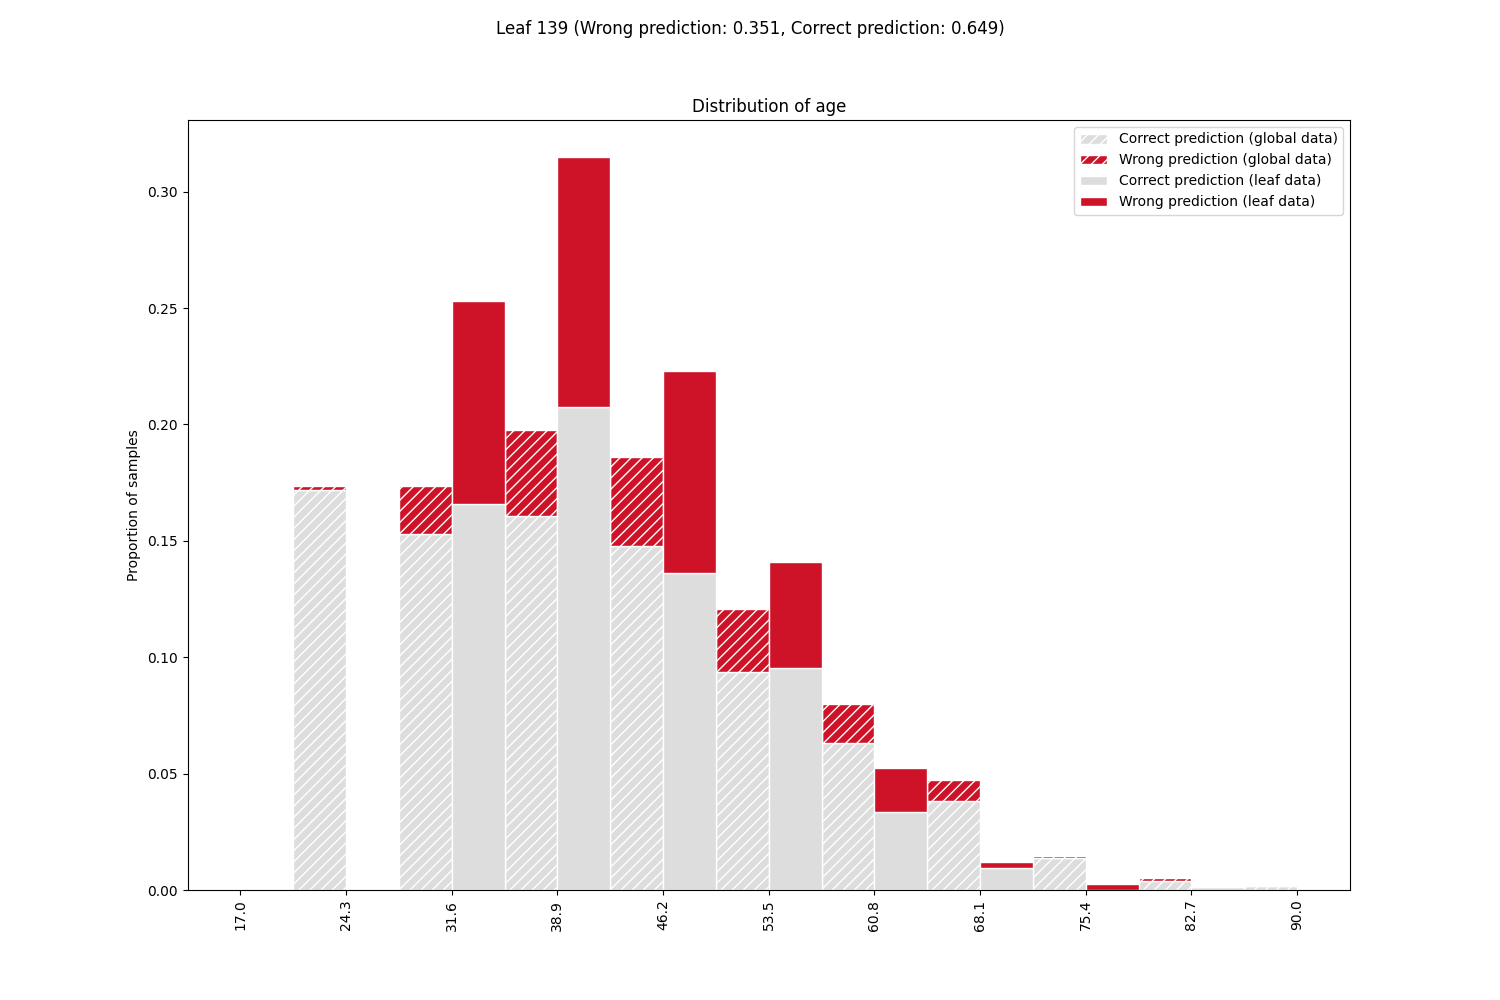
Plot the feature distributions of samples in the leaf containing the majority of errors. Rank features by correlation to error.
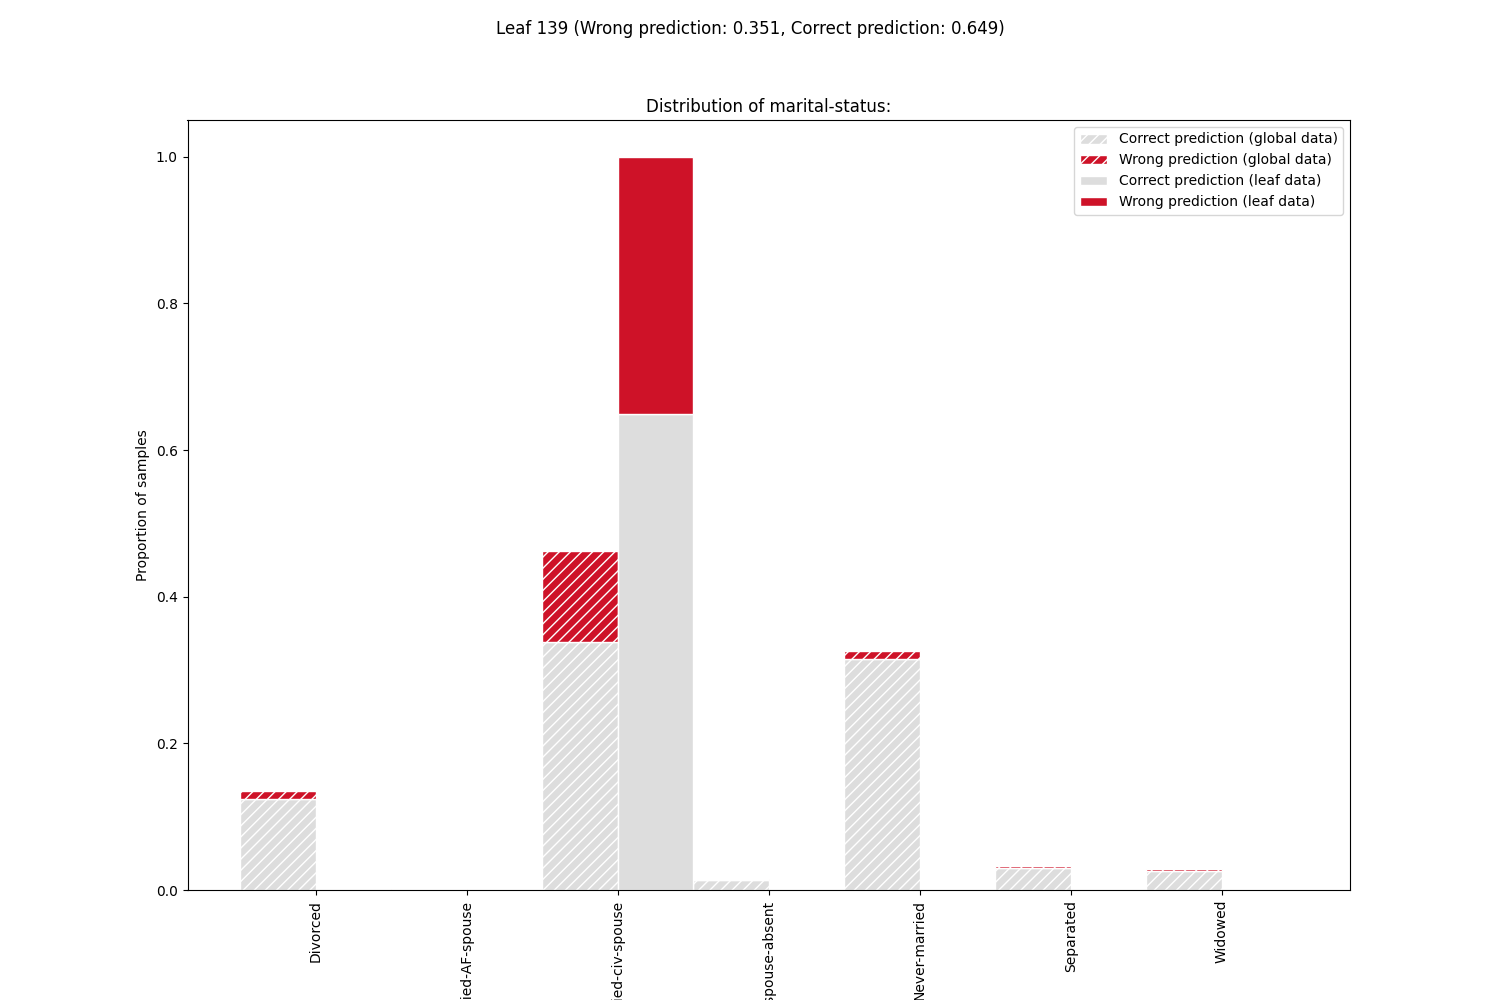
Discussion
Error Tree Metrics
We are dealing with a binary classification task. Here the primary predictions of “income less or more than 50k” have been categorized in two classes: ‘Correct prediction’ and ‘Wrong prediction’ according to the difference from the true class. The accuracy is then the number of Correct predictions over the total. The Error Tree might not be representative of the behavior of the primary model as the true primary accuracy and the one estimated by the Error Tree are not close.
Model Failures
Let’s focus on the nodes of the Error Tree, in particular the leaves
of class ‘Wrong prediction’. These leaves contain the majority of errors, each
leaf clustering a subpopulation of errors with different feature values. The largest
and purest failure nodes are highlighted when printing the error node summary, and
also when plotting the feature distributions in the node (leaf_selector=None).
From the feature distributions, sorted by correlation with the error, we can see that
the majority of problems occur for married people.
In the next iteration of model design, the primary model needs to be improved for these
subpopulations.
Total running time of the script: ( 0 minutes 7.435 seconds)